Code Coverage is used to check how much of the code you have written is being tested with your unit test. So to measure your code coverage, just click on "Analyze Code Coverage for All Tests" under "Run..." in "Test Explorer" window. By doing so, visual studio will execute all your unit test and automatically open up "Code Coverage Results" window, in which will shows how much of your code is being covered in percentage.
But what if you have a unit test method that calls the service (WCF, WEB API, etc) and need to measure the code coverage for the services. By clicking on "Analyze Code Coverage for All Tests", the visual studio will only show you the code coverage result for projects that are directly referenced by your unit test project. So, for visual studio to display code coverage for your services, some extra settings and steps need to be done and will need to rely on .testsettings File.
To create a new Test Settings file, right click on a
solution folder, hover to "Add" and click "New Item..." (create 1 in your solution if you do not have it). A
Test Settings window will be prompted. This window is where you need to do some configuration to enable code coverage.
The following are the steps to be done to configure the
Test Settings file:
1) On the left pane of this window, click "Data and Diagnostics".
 |
| Test Settings |
2) On the middle pane under "Data and Diagnostics for selected role:", click on "Code Coverage (Visual Studio 2010)"'s check box to enable it.
 |
| Data and Diagnostics |
3) In case "Code Coverage (Visual Studio 2010)" deselected after tick the checkbox, select it again and click Configure. A window titled "Code Coverage (Visual Studio 2010) Detail" will be prompted.
4) Click "Add Assembly..." button. A window titled "Choose Assemblies to Instrument" will be prompted.
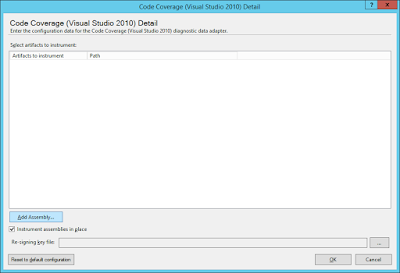 |
| Code Coverage (Visual Studio 2010) Detail |
5) Browse for the necessary DLLs used/generated by your services project & the unit test project's DLL. Make sure those DLLs contain .pdb file reside in the same folder. Click "Open" button once you are done.
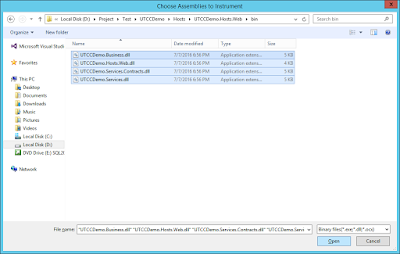 |
| Choose Assemblies to Instrument |
6) Make sure those DLLs that you have browsed earlier are shown under "Select artifacts to instrument" and are ticked. Click "OK" button once you have verified.
 |
| Code Coverage (Visual Studio 2010) Detail with DLLs |
7) On the left pane of "Test Settings" window, click "Test Results Names". It is optional whether you want to change the name. But if you leave it as default, please remember how the name is being defined as shown on the "example". This is important as you will need to navigate to the folder later.
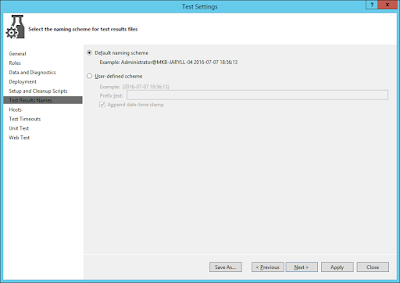 |
| Test Results Names |
8) Click "Apply" button and click "Close" button.
Once you have done configure the Test Settings file, the file need to be included with your Unit Test. To do so, click "TEST" menu, which is located on top of your visual studio. Hover to Test Settings and click "Select Test Settings File". Browsed for the Test Settings file that you have created and configured earlier.
Before running the unit test, make sure your services is up and running and the "Code Coverage Results" window is shown on your visual studio. In case you can't locate it, just initiate a code coverage test and the "Code Coverage Results" window will appear. Once you are ready, click "Run All" or "Run Selected Tests" (depend on whether you want to get code coverage for all tests or just measure the specific test).
After all the unit tests have been executed, the result of the code coverage will be generated into a file named "data.coverage" and placed in "TestResults" folder located in your own project. So to show the result on "Code Coverage Results" window in your visual studio:
1) Click "Import Results" icon button.
 |
| Code Coverage Results Window |
2) On the "Open Coverage File" window, open "TestResults" folder.
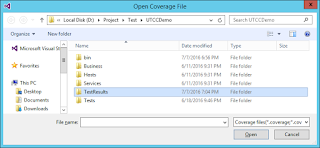 |
| Open Coverage File Window |
3) Open the latest generated folder and the folder name must based on the option you defined on the step 7th earlier.
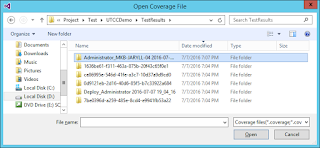 |
| Select Latest Folder with Name as Defined in TestSetttings File |
4) Open "In" folder and navigate deep in until you see the file "data.coverage".
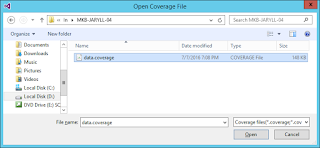 |
| data.coverage File |
5) Choose the file and the result will be shown on "Code Coverage Results" window.
 |
| data.coverage File's Result |
Refer to the following link for the sample demo project.
https://1drv.ms/u/s!Aj2AA7hoIWHmgmdSKO6YHPcACD5j. This sample is being developed in layered based on this link.
http://serena-yeoh.blogspot.com/2014/03/layered-architecture-solution-guidance.html


No comments:
Post a Comment